Operations
Part of Dental social media: workflows and safeguards
Dental social media benchmarks with the caveats attached
dental social media benchmarks for 2027 compare matched platforms, formats, audiences, definitions, periods, paid status, task outcomes, safety, and data coverage.
What to take away
- Test your own figures against these typical organic rangesInstagram engagement 1 to 3 percent of followers, TikTok 3 to 6 percent per view.
- Facebook reach typically lands at 2 to 6 percent of followers. LinkedIn engagement typically runs 2 to 5 percent of impressions.
- Paid distribution raises reach and lowers engagement rate. Budget on cost per booked appointment instead.
- No public study gives verified national dental figures. Every range here is a starting check, not a dental median.
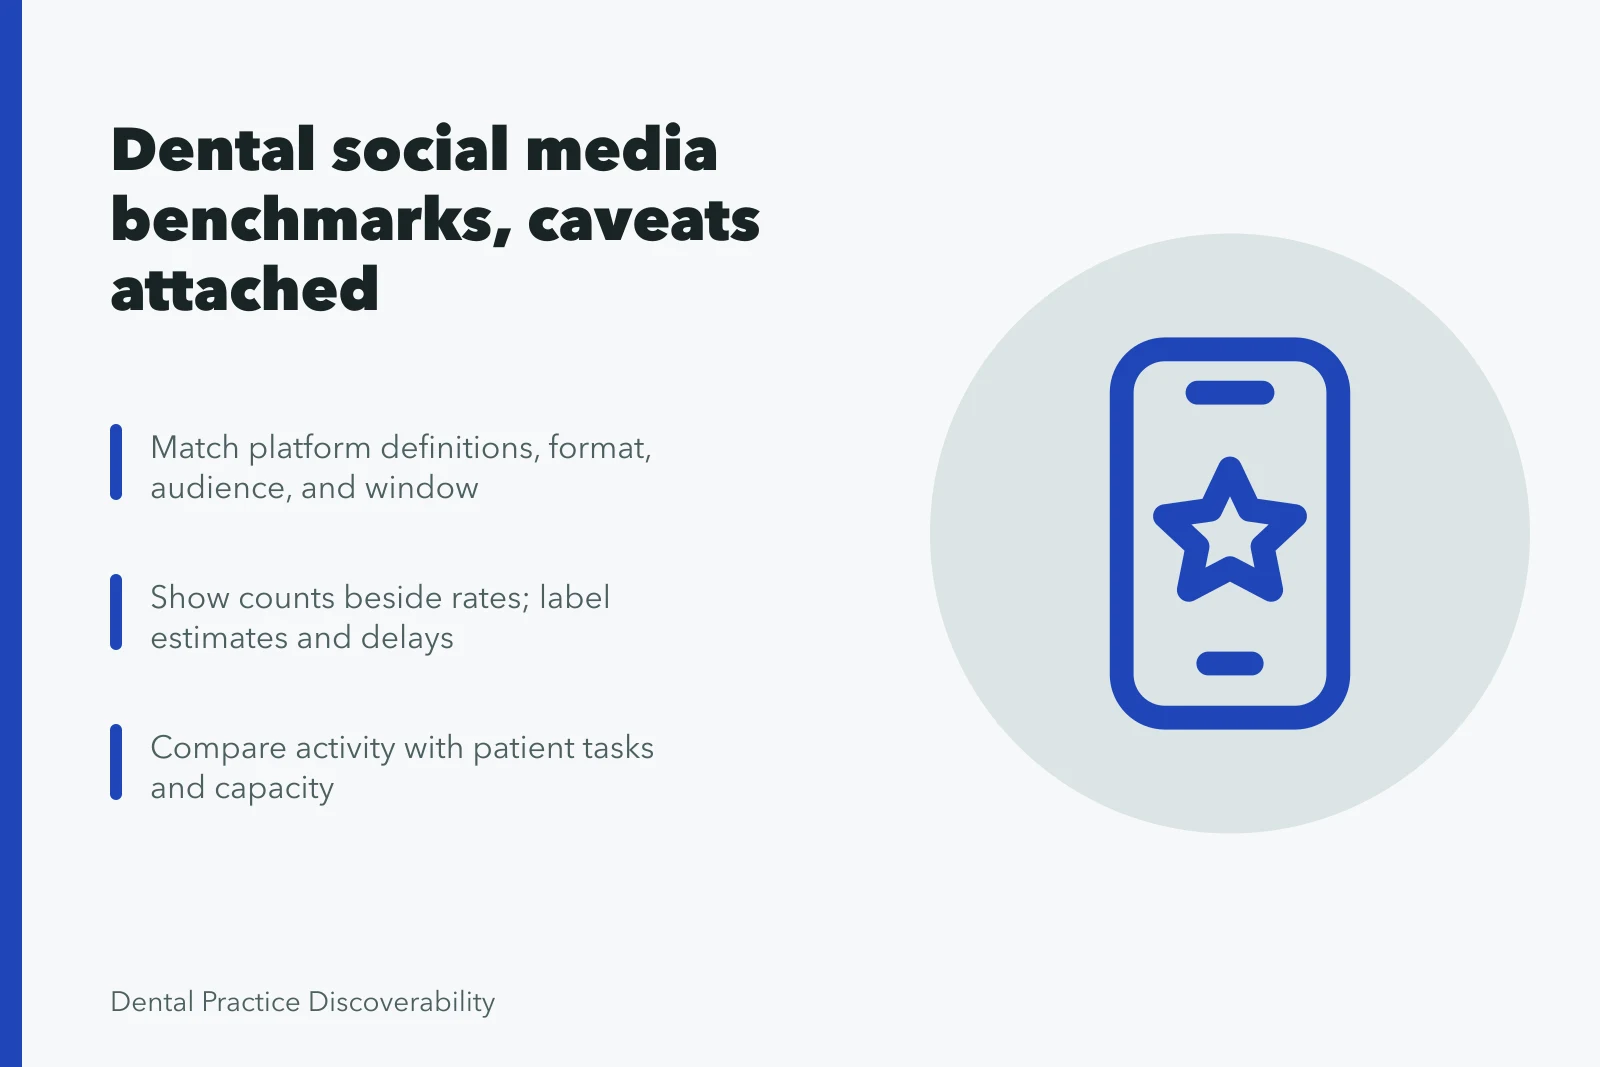
- A benchmark is comparable only when platform definition, denominator, distribution and date range match.
Benchmark figures to compare against
The table gives platform-wide typical ranges, not dental medians. Reading dental social media reporting with a sceptical eye means asking which denominator produced any figure you compare. Use these ranges to catch a number that is far out of line, then replace them with your own 90-day data.
| Platform | Metric | Typical organic range | Typical paid range |
|---|---|---|---|
| Engagement rate, interactions per follower | 1 to 3 percent | 0.5 to 2 percent per reach | |
| Facebook Page | Reach as a share of followers | 2 to 6 percent | set by budget and audience size |
| TikTok | Engagement rate, interactions per view | 3 to 6 percent | varies with creative and targeting |
| LinkedIn Page | Engagement rate, interactions per impression | 2 to 5 percent | boosting adds impressions, not rate |
| YouTube | Average view duration | 30 to 50 percent of video length | skippable ads report different metrics |
| Google Business Profile | Calls, direction requests and website clicks | driven by local search volume | not applicable |
These ranges come from platform-wide industry reporting. Dental-specific averages are published mostly by marketing vendors, and their samples, dates and definitions are rarely disclosed.
Cost per booked appointment beats cost per click
Paid numbers compare cleanly because the unit is money, not a platform-defined interaction. Typical reported ranges for dental advertising sit near USD 0.50 to 3 per click and USD 40 to 150 per booked appointment. Treat both as starting points.
Why one platform rate cannot be compared with another
LinkedIn divides interactions by impressions. Instagram often divides by followers, which includes dormant accounts.
LinkedIn Page Metrics to Check
- ImpressionsLinkedIn Page content analytics
- Members reachedLinkedIn Page content analytics
- ClicksLinkedIn Page content analytics
- ReactionsLinkedIn Page content analytics
- CommentsLinkedIn Page content analytics
- RepostsLinkedIn Page content analytics
- Engagement rateLinkedIn Page content analytics
Facebook reach is a share of followers, not of viewers. Reels, stories, carousels and boosted posts each use a different denominator inside the same platform. A rate without its denominator is decoration.
Privacy and advertising rules constrain what you publish next to the number. The HIPAA Privacy Rule governs patient information in the post behind the metric, and the FTC guidance on health products compliance governs claims about outcomes.
A view count is not evidence that a treatment works. A prepublication checklist for dental social media keeps claims and counts consistent before anything posts.
Build an internal benchmark in four steps
- Fix one content class. Hold platform, format, topic and duration constant so the class repeats.
- Export raw metrics for 90 days plus a matched prior period. Record publication and extraction dates.
- Report counts and rates side by sidereach, interactions, clicks to the booking page, completed bookings.
- Set a review trigger. Name the change that forces an earlier recheck, such as a platform redefining a metric.
The GAO evaluation design guide ties the question you ask to the evidence you gather. A benchmark card needs that discipline, which is why the review date and the definitions belong on the same page.
Example: one benchmark card for one content class
Platform: Instagram, practice account. Content class: 45-second treatment explainer, organic feed post. Window: 1 January to 31 March, compared with the same quarter a year earlier. Denominator: follower count at extraction date. Result: engagement rate 1.4 percent, reach 380, 6 clicks to the booking page, 2 booked appointments. Guardrails: 1 comment corrected, 0 privacy incidents, median response time under 4 hours.
Watch time, followers and reach as benchmarks
Watch time and retention show where viewers stop watching. They do not show that a patient understood a consent conversation. Dental marketing strategy best practices explains how to keep one definition set across a year of campaigns rather than rebuilding it each quarter.
Short-form retention commonly lands between 30 and 50 percent of video length. The NIST guidance on choosing an experimental design starts from the objective and the practical constraint, which is the right frame for asking whether a figure is a target or a diagnostic.
Followers are the weakest of the four benchmarks. A page with 20,000 followers at 1 percent reach delivers fewer views than a page with 3,000 followers at 8 percent. Reach beats followers, and booked appointments beat reach.
Record the rejected options too, because the constraint that ruled them out can change. Keep the raw export and the dated card together for the review.
Setting the next review date
Set the next review date and name the change that would move it earlier, such as a platform redefining a metric, a new ad format, or a paid channel that suddenly dominates reach.
Dental SEO benchmarks applies the same matching rules to search data, which matters when social and search figures share one board slide.